
Performance
VSKI publishes honest benchmarks. The harness, the load scripts and the reference services all live in the platform repository, every number on this page can be regenerated with two make commands, and the published results file is generated from the raw run data, never hand-edited. Because VSKI keeps its storage inside the server process, the same numbers double as a fair measure of SQLite itself under concurrent API traffic: if you want to know what SQLite in WAL mode delivers behind a REST API, this is a good way to find out.
At a glance
Section titled “At a glance”| Sustained throughput | 10,000+ RPS in every scenario, zero errors |
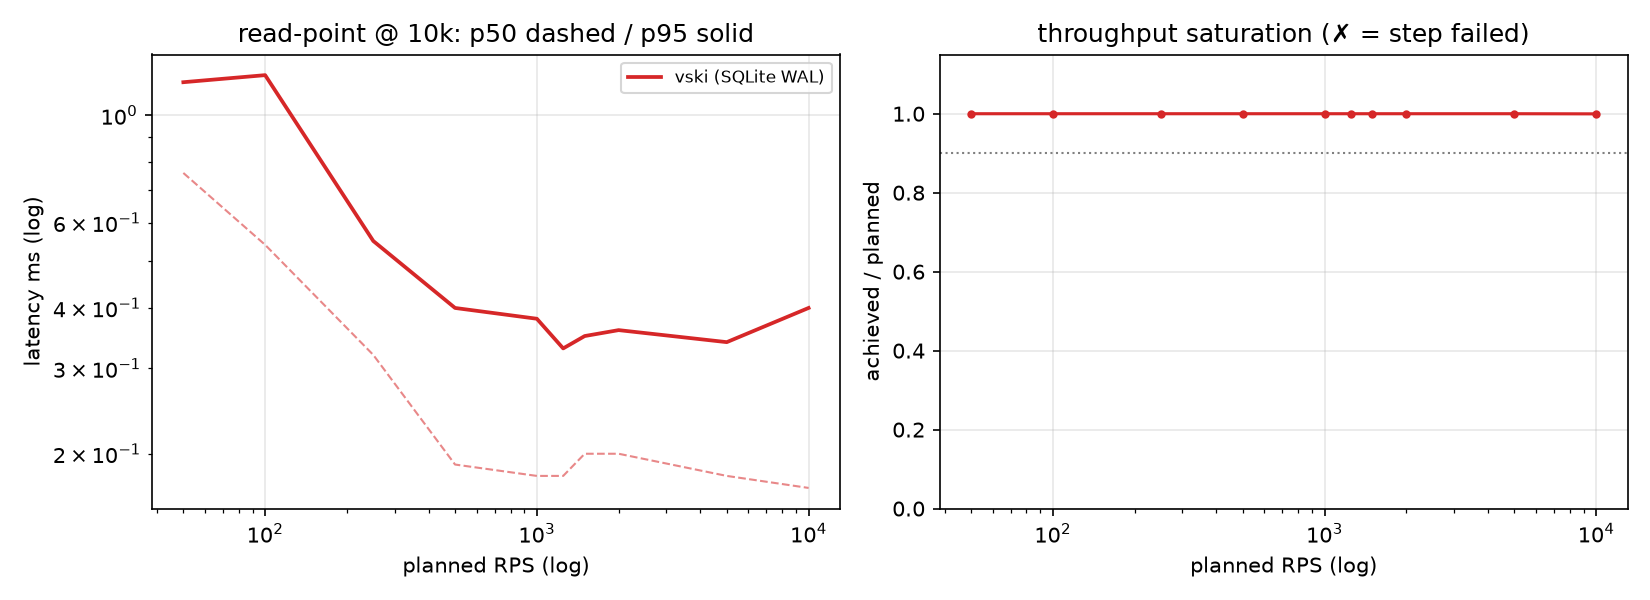
| Point read latency | p95 0.40 ms, p50 0.17 ms |
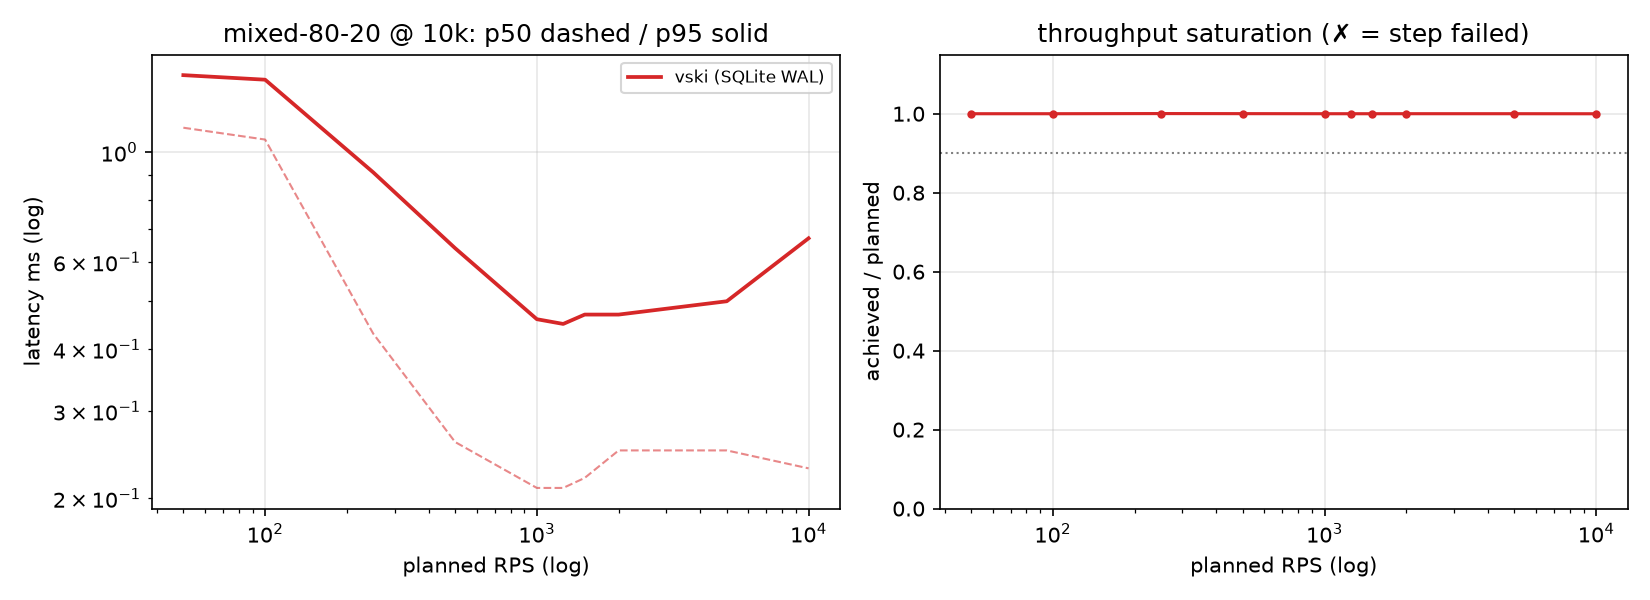
| Mixed 80/20 traffic | p95 0.67 ms at 10,000 RPS, under 0.7 ms from 1,000 RPS up |
| Paged lists | p95 1.02 ms at 10,000 RPS, against 13.7 ms on Postgres |
| Memory under load | about 500 MB at 2,500 write RPS, about 30 MB idle |
| Against Postgres 17 | same sustained throughput on every scenario, ahead on lists, filters and mixed traffic |
| Against MySQL 8.4 | level or ahead on every scenario |
| The honest limit | write tails grow past about 5,000 RPS, where Postgres stays lower; latency, not errors |
Measured on VSKI v0.17.0, one instance, one SQLite database, no balancer, no replicas.
How the benchmark runs
Section titled “How the benchmark runs”Everything runs in Docker on one Linux host (AMD Ryzen AI 9 HX 370, 24 threads, 46 GB RAM, NVMe SSD): VSKI under test, the reference services, the k6 load generator and the report generation.
The reference targets are deliberately minimal Go services over Postgres 17 and MySQL 8.4. They mirror VSKI’s routes, response envelopes and per-request query shape: a create is an INSERT plus a read-back, a list is a COUNT plus a paginated SELECT, one auth lookup per request, primary-key index only. The same k6 scripts drive all three targets, so the only variables are the storage engine and the server implementation. Neither side gets tuning beyond its defaults. The Postgres and MySQL numbers come from the initial full run on the same rig with the same scripts; all VSKI numbers come from the v0.17.0 run.
Load is open-model: k6 fires requests at the planned rate no matter how slow
the responses get (constant-arrival-rate). That is what exposes how a server
degrades past saturation instead of hiding it behind backpressure. Each
scenario climbs a rate ladder (50, 100, 250, 500, 1,000, 1,250, 1,500, 2,000,
5,000 and 10,000 RPS), 60 seconds per step, and the ladder stops early once
a target delivers less than 90% of the planned rate or more than 1% errors.
The highest healthy step is that scenario’s max sustained RPS. Datasets run
at 10,000 and 100,000 records so you can see how the numbers move as tables
grow. The benchmark collection carries no secondary indexes, only the
automatic created index, so the headline tables show the storage engine’s
baseline.
What it measures
Section titled “What it measures”| Scenario | What it does |
|---|---|
read-point | fetch one record by id |
read-list | paginated list, 30 per page, exact totals |
read-list-skiptotal | the same list with skipTotal=true, no count |
read-filter-sort | filter on published=true (matches every row), sorted by created |
read-filter-selective | filter matching about 1% of rows, sorted by created, no index on the filtered field |
read-filter-selective-idx | the same selective query with an index on the filtered field |
write-create | create a record of about 150 B |
write-create-large | create a record of about 10 KB |
write-update | update an existing record |
mixed-80-20 | 80% point reads mixed with 20% creates |
auth-apikey | point read authenticated with an API key (VSKI only) |
Results
Section titled “Results”Max sustained RPS, 10,000 records:
| Scenario | vski (SQLite WAL) | refapi-postgres | refapi-mysql |
|---|---|---|---|
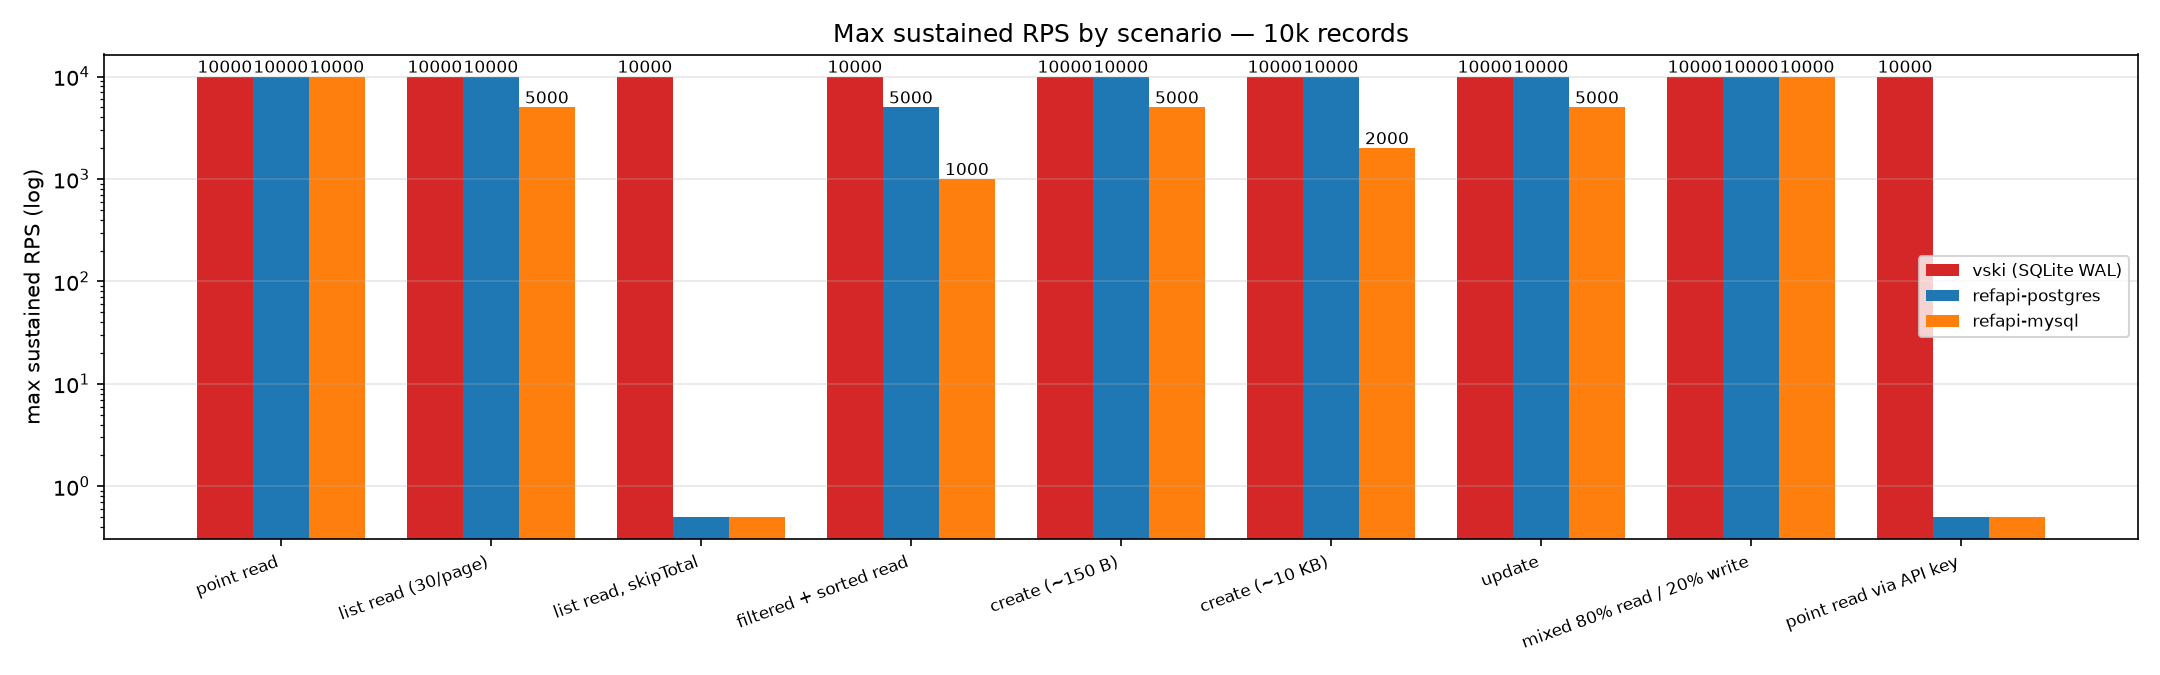
| point read | 10,000+ (p95 0.40 ms) | 10,000+ (p95 0.27 ms) | 10,000+ (p95 0.37 ms) |
| list read, 30/page | 10,000+ (p95 1.02 ms) | 10,000+ (p95 13.7 ms) | 5,000 (p95 45.8 ms) |
| list read, skipTotal | 10,000+ (p95 1.14 ms) | n/a | n/a |
| filtered + sorted read | 10,000+ (p95 116.2 ms) | 5,000 (p95 5.62 ms) | 1,000 (p95 11.3 ms) |
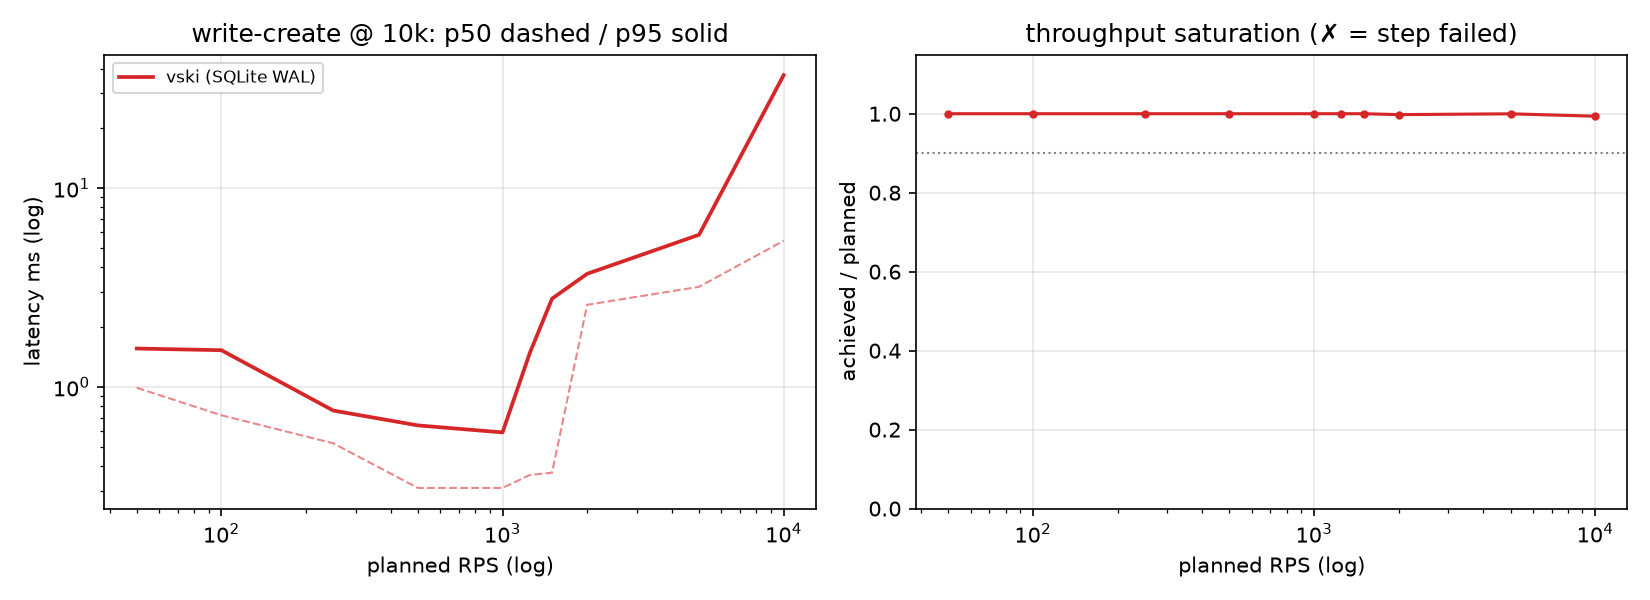
| create (~150 B) | 10,000+ (p95 37.1 ms) | 10,000+ (p95 6.99 ms) | 5,000 (p95 150.9 ms) |
| create (~10 KB) | 10,000+ (p95 194.5 ms) | 10,000+ (p95 7.99 ms) | 2,000 (p95 896.1 ms) |
| update | 10,000+ (p95 8.63 ms) | 10,000+ (p95 6.11 ms) | 5,000 (p95 56.3 ms) |
| mixed 80/20 | 10,000+ (p95 0.67 ms) | 10,000+ (p95 4.05 ms) | 10,000+ (p95 23.0 ms) |
| point read via API key | 10,000+ (p95 0.30 ms) | n/a | n/a |
10,000+ means the target cleared the top of the rate ladder: generator
headroom, not a server limit. The p95 in brackets is measured at each
target’s own max sustained step, so latencies compare directly only where the
max matches: on filtered reads VSKI’s 116 ms is at 10,000 RPS, Postgres’s
5.6 ms at 5,000.
Latency at sustained load, 10,000 records, milliseconds:
| Scenario | vski p50 / p95 | Postgres p50 / p95 | MySQL p50 / p95 |
|---|---|---|---|
| point read | 0.17 / 0.40 | 0.12 / 0.27 | 0.18 / 0.37 |
| list read, 30/page | 0.39 / 1.02 | 1.75 / 13.7 | 11.6 / 45.8 |
| list read, skipTotal | 0.44 / 1.14 | n/a | n/a |
| filtered + sorted read | 13.0 / 116.2 | 2.77 / 5.62 | 6.79 / 11.3 |
| create (~150 B) | 5.44 / 37.1 | 3.78 / 6.99 | 23.9 / 150.9 |
| create (~10 KB) | 26.2 / 194.5 | 4.32 / 7.99 | 378.1 / 896.1 |
| update | 3.30 / 8.63 | 3.82 / 6.11 | 18.1 / 56.3 |
| mixed 80/20 | 0.23 / 0.67 | 0.18 / 4.05 | 0.28 / 23.0 |
| point read via API key | 0.15 / 0.30 | n/a | n/a |
From 10,000 to 100,000 records:
| Scenario (vski) | 10k records | 100k records |
|---|---|---|
| point read | 10,000 RPS, p95 0.40 ms | 10,000 RPS, p95 0.42 ms |
| list read, 30/page | 10,000 RPS, p95 1.02 ms | 5,000 RPS, p95 2.79 ms |
| list read, skipTotal | 10,000 RPS, p95 1.14 ms | 10,000 RPS, p95 1.16 ms |
| filtered + sorted read | 10,000 RPS, p95 116.2 ms | 2,000 RPS, p95 5.13 ms |
Selective filter (about 1% of rows, sorted by created), with and without
an index on the filtered field:
| Dataset | no index | with index |
|---|---|---|
| 10k records | 10,000 RPS, p95 116.8 ms | 10,000 RPS, p95 124.1 ms |
| 100k records | 1,250 RPS, p95 446.3 ms | 10,000 RPS, p95 95.9 ms |
Two more measurements from the same run. Auth is cheap on either path: at 50 RPS the same point read costs p50 1.08 ms with an API key and p50 0.76 ms with a JWT. And plan disk headroom for write-heavy deployments: during the heaviest write bursts the WAL file reached 3.2 GB before checkpoints reclaimed the space automatically.
Charts
Section titled “Charts”Where each target saturates, scenario by scenario:
Point reads stay flat and sub-millisecond from 500 RPS to the top of the ladder, p95 0.40 ms at 10,000 RPS:
Writes keep p95 under 6 ms through 5,000 RPS and climb to 37 ms at 10,000 as the write queue batches commits under saturation; throughput holds and no request fails:
Mixed traffic is the one that matters for real services: readers never notice the writer, p95 stays under 0.7 ms from 1,000 RPS to 10,000:
Takeaways
Section titled “Takeaways”Three things the runs taught us, worth knowing before you size a deployment.
Control your counts
Section titled “Control your counts”VSKI does not cache counts. Many servers answer list calls from a warm
total; VSKI counts matching rows on every list request, which is the honest
price of exact totals, and on a large collection it is the first thing that
gets slower as the table grows. At 100,000 records a list with counts
sustains 5,000 RPS (p95 2.79 ms); the same list with skipTotal=true
sustains 10,000 RPS (p95 1.16 ms). Totals come back as -1, which is exactly
what an infinite-scroll UI wants. See
Skipping Totals (Fast Lists).
Know your indexes
Section titled “Know your indexes”The storage engine sits close to the disk, and a filter without an index means digging through the table row by row. At 10,000 records the scan is cheap enough that an index makes no difference. At 100,000 records it is the whole difference: the same selective query sustains 1,250 RPS (p95 446 ms) without an index and 10,000 RPS (p95 96 ms) with one. Put an index on every field you filter or sort by; indexes are declared in the IaC YAML next to the collection and applied with the rest of the schema.
The honest summary
Section titled “The honest summary”On a single instance, with zero tuning, VSKI sustains the same throughput as a hand-rolled Go service over Postgres on every scenario, and beats it on paged lists, filtered reads and mixed traffic. Postgres keeps lower write tail latency at the top of the ladder. Against MySQL, VSKI is level or ahead everywhere. Up to about 5,000 RPS every test behaves close to idle; degradation starts past that, and it shows up as latency growth, never as errors: the whole run finished with zero failed requests.
Reproduce it
Section titled “Reproduce it”git clone https://vski.sh/x/platform.gitcd platform/benchmarksmake quick # smoke subset, 15-25 minmake bench # full suite, all targets, 2-4 hmake publish # regenerate the published BENCHMARK.md and chartsScenario definitions, knobs and the iteration loop for VSKI-only changes are in the benchmarks README; the published numbers live in BENCHMARK.md.